-
MA-1-PACF.png
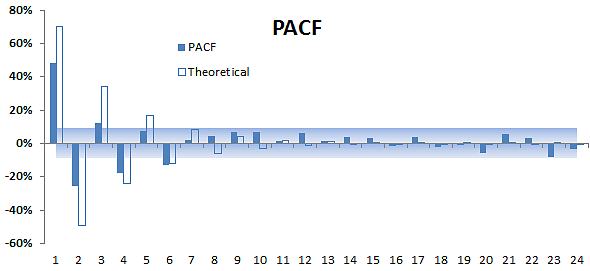
PACF Plot for Simulated MA(1) Process
-
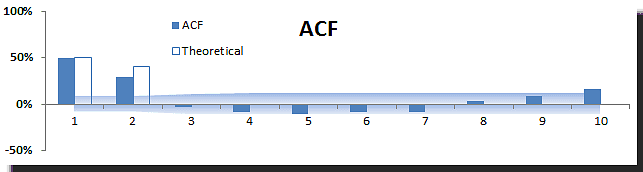
ARMA-1-1-ACF.png
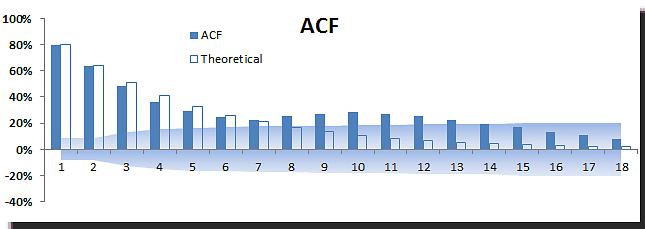
ACF Plot for Simulated ARMA(1,1) Process
-
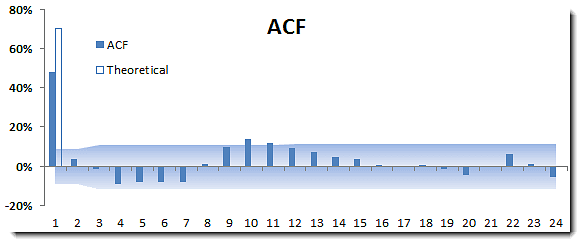
AR-2-ACF.png
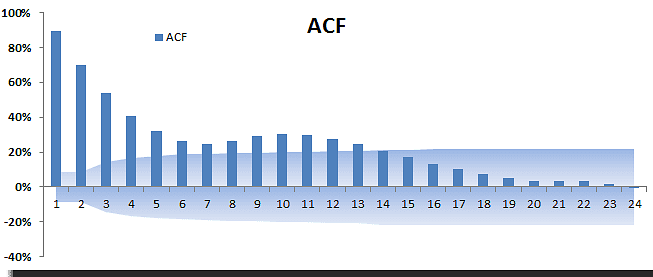
ACF Plot For Simulated AR(2) Process
-
AR-1-ACF.png
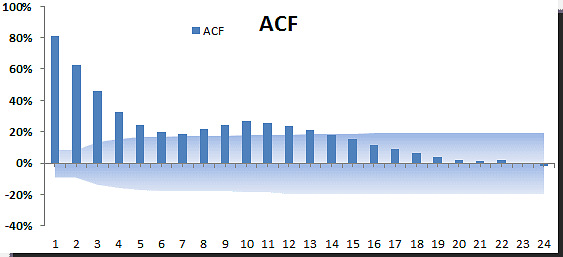
ACF Plot For a Simulated AR(1) Process
-
MA-2-ACF.png
Autocorrelation Function Plot for Simulated MA(2) Process
-
MA-1-ACF.png
Autocorrelation Function Plot for Simulated MA(1) Process
-
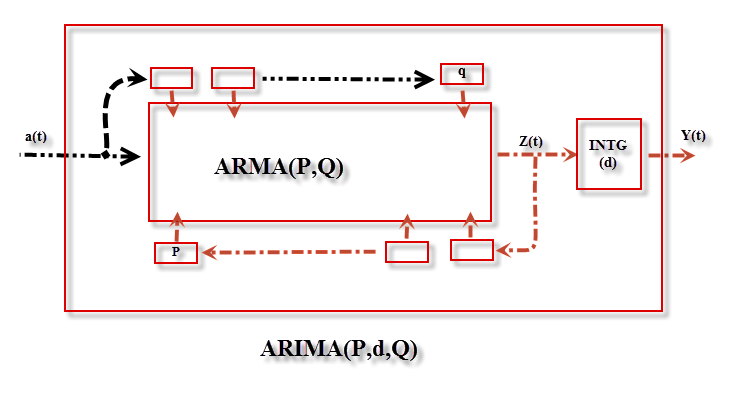
ARIMA-Machine.png
A graphical representation of an ARIMA Excel process
-
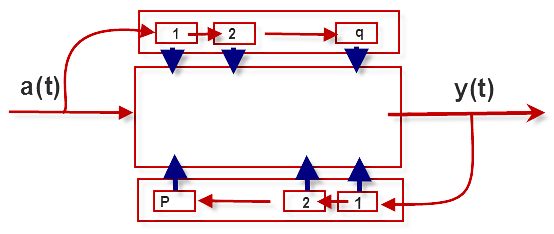
System-view.png
-
IBM-RET-SQ-CORRELOGRAM-PLOT.png
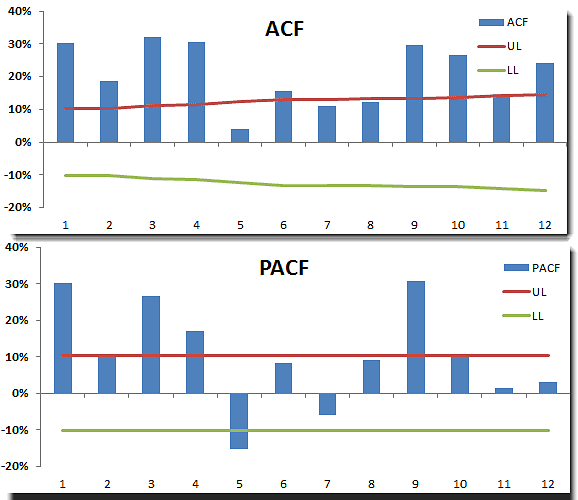
IBM Squared Time Series ACF and PACF Plots
-
IBM-RET-SQ-CORRELOGRAM-TBL.png
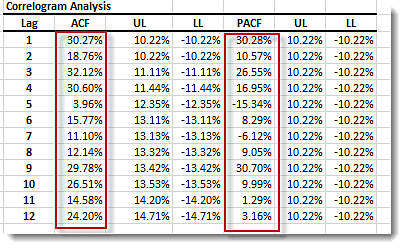
IBM Returns Correlogram Analysis Table
-
IBM-DLY-SQ-DESC-STAT.png
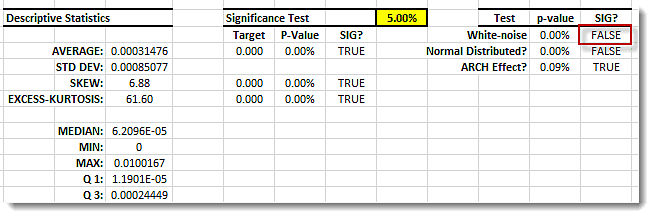
IBM squared Returns Descriptive Statistics
-
IBM-RET-SQ-PLOT.png
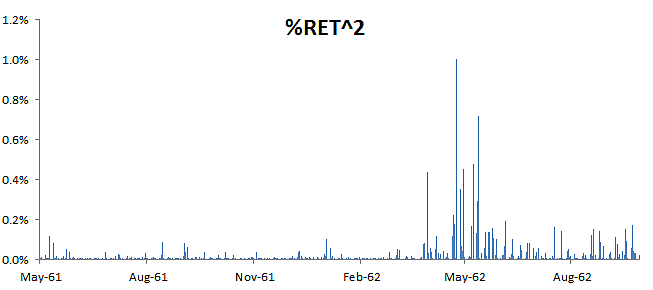
IBM Returns Squared Time Series Plot
-
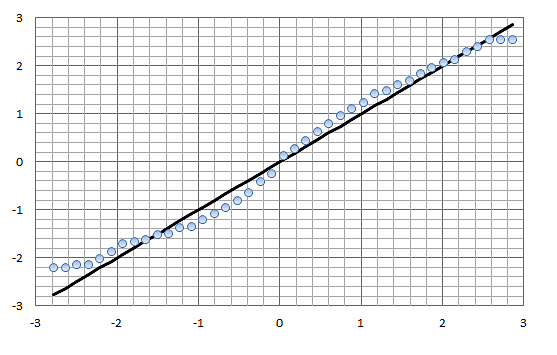
IBM-QQPlot.png
IBM Returns QQ Plot
-
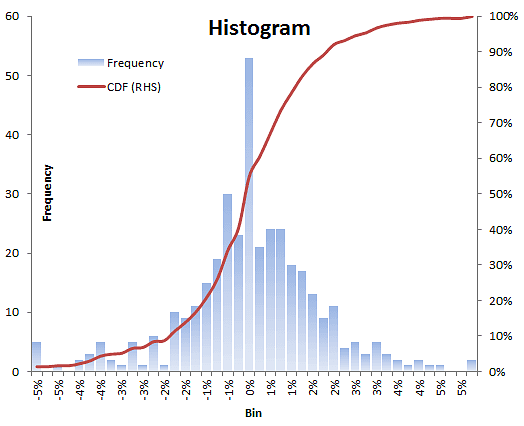
IBM-RET-HIST.png
IBM Returns Histogram
-
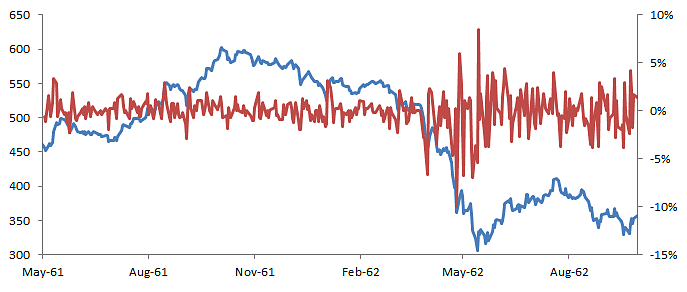
IBM-PRICE-RET-PLOT.png
IBM Price Returns Plot
-

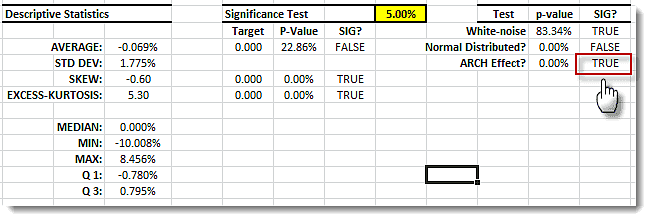
IBM-DLY-DESC-STATS.png
IBM Daily Returns Descriptive Statistics
-
IBM-DLY-DESC-STATS.png
IBM Daily Returns Descriptive Statistics
-
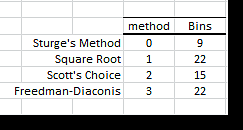
Histogram-bins-method-table.png
Summary of number of bins calculated by 4 different methods
-
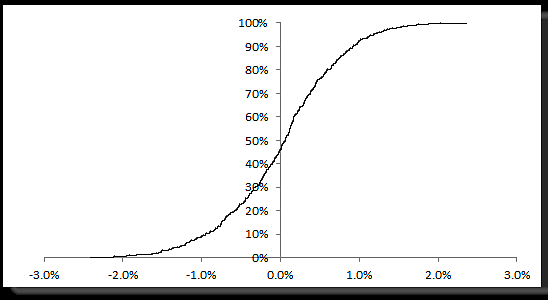
EDF-PLOT.png
Empirical density function for the EUR/USD daily log returns
-
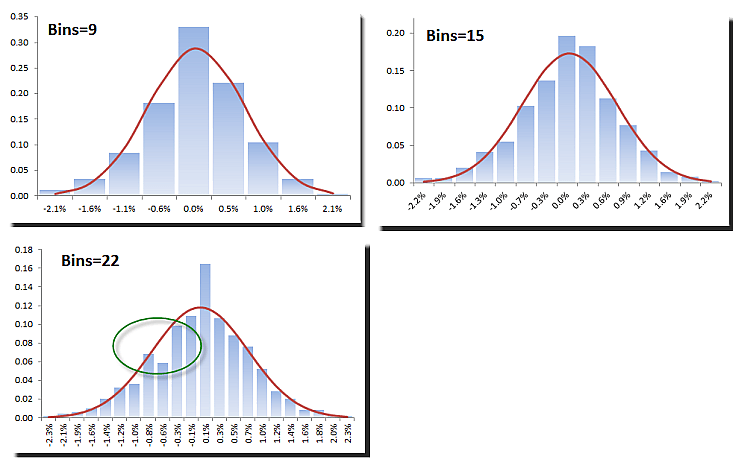
EURUSD-HIST-ALL.png
Excel Histogram plots using different number of bins
-
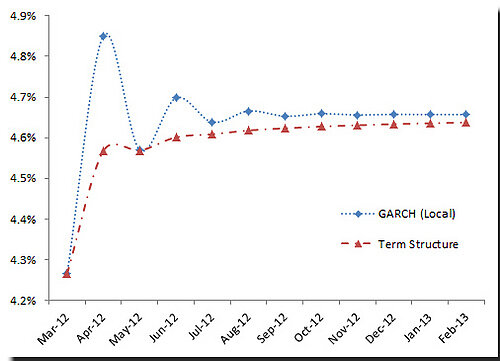
7508700742_a39dc099cf.jpg
Term Structure Volatility for S&P 500