-
Jacque-Bera_0.png
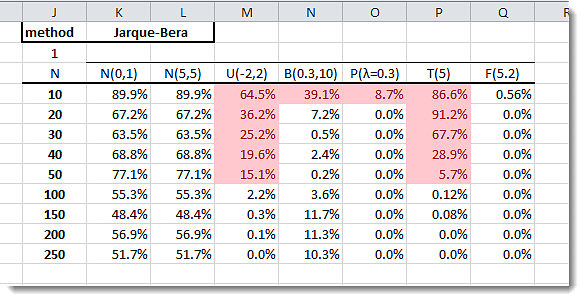
Jarque-Bera Normality Test Table
-
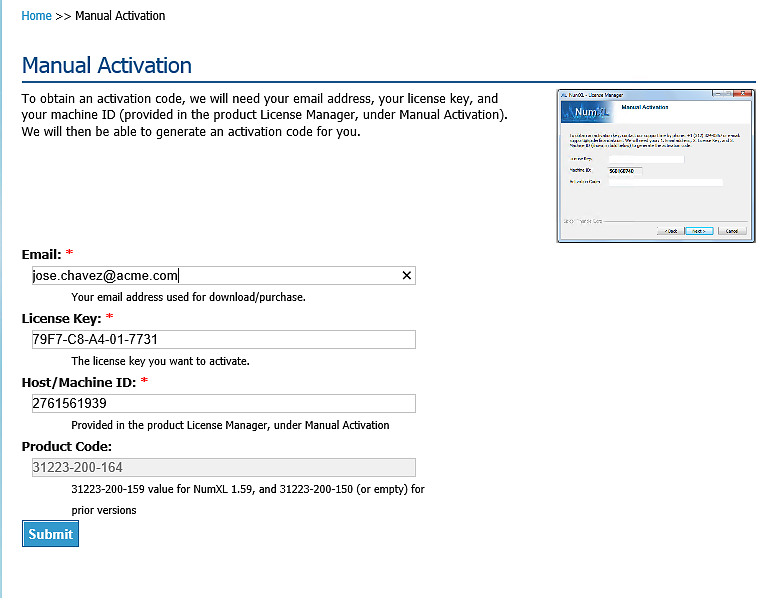
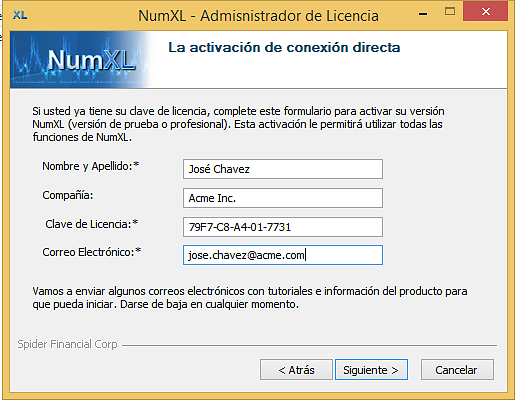
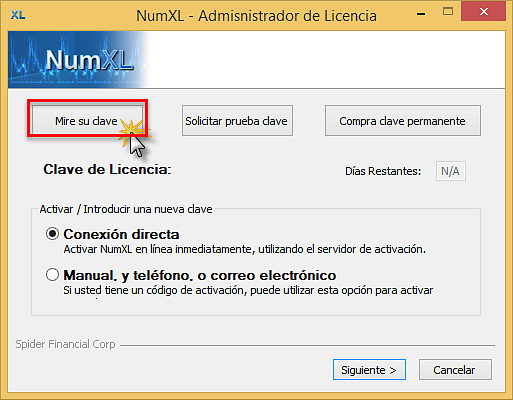
lm-activation-manual-webform.png
-
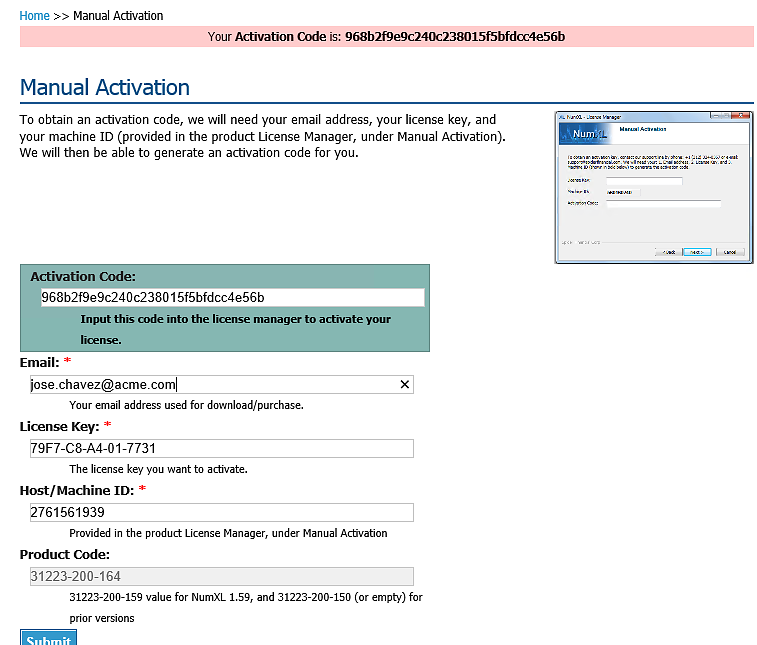
lm-activation-manual-webform-confirm.png
-
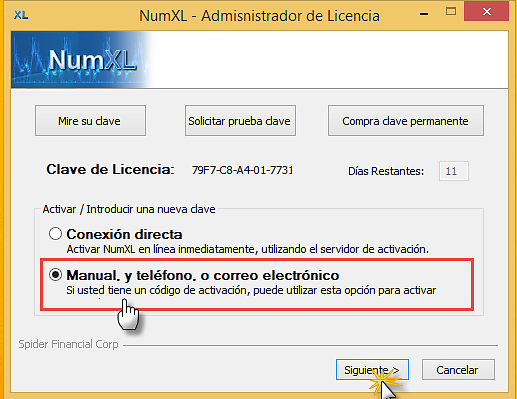
lm-activation-manual-page1.png
-
lm-activation-direct-page2.png
-
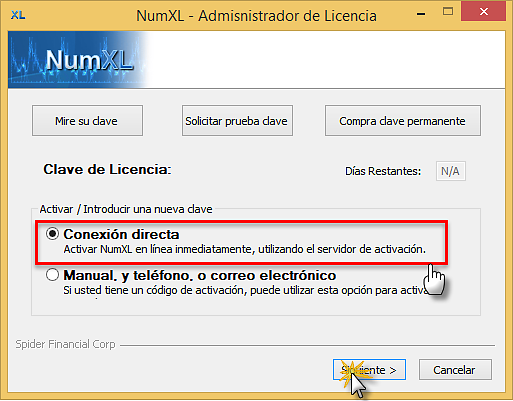
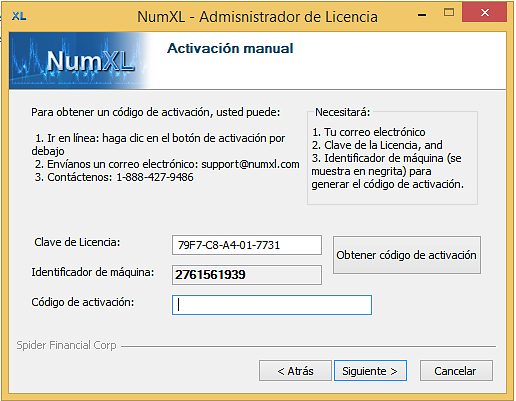
lm-activation-direct-page1.png
-
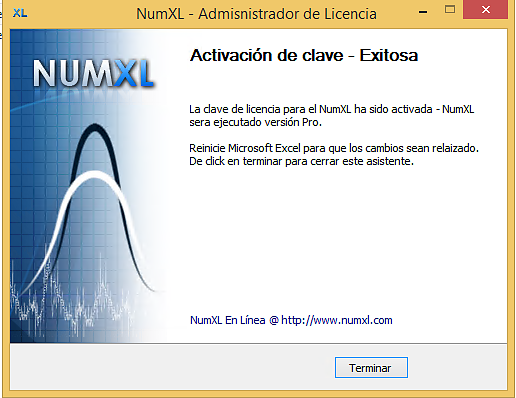
lm-activation-direct-confirm-page.png
-
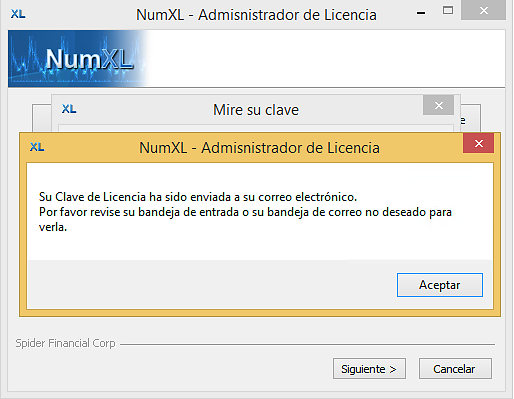
m-lookup-key-confirm.png
-
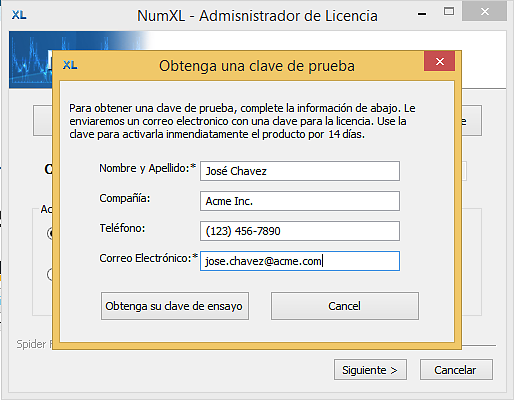
lm-request-14-day-trial-page2.png
-
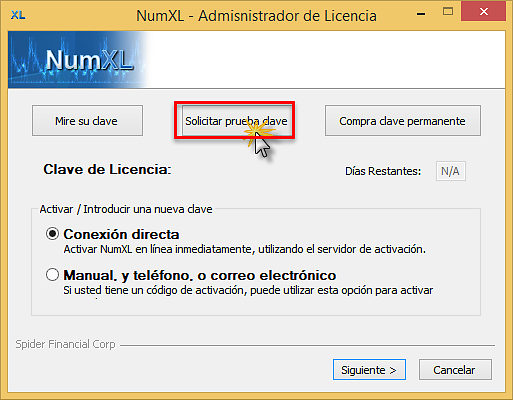
lm-request-14-day-trial-page1.png
-
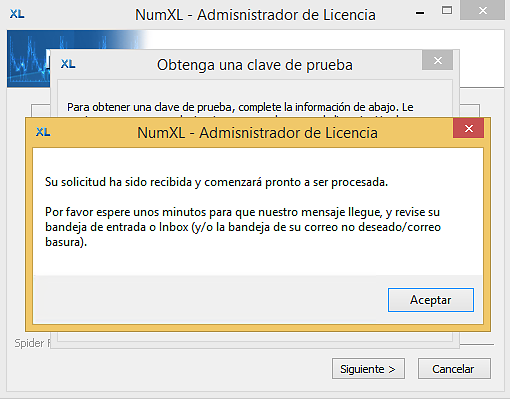
lm-request-14-day-trial-confirm-page.png
-
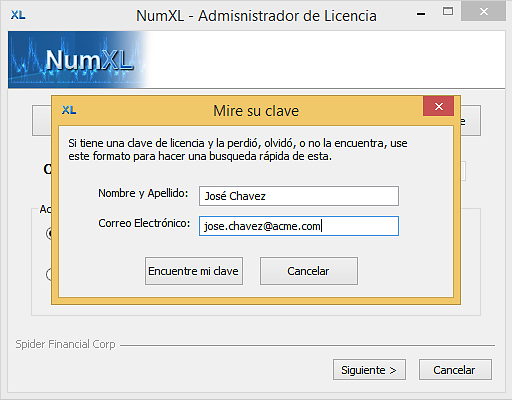
lm-lookup-key-form.png
-
lm-lookup-key.png
-
lm-activation-manual-page2.png
-
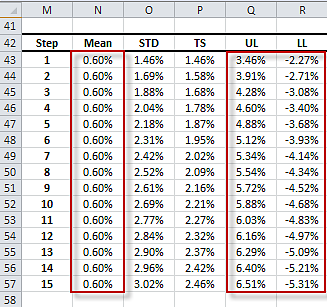
Forecast table for GARCH(1,1) model
he NumXL Forecast wizard generates a table with forecast value for the mean and Upper/Lower limits for the confidence interval. Th…
-

ar_dbl_blue.png
-

Hyperlink.tiny.jpg
-
GED-XKURT-Plot.png
-
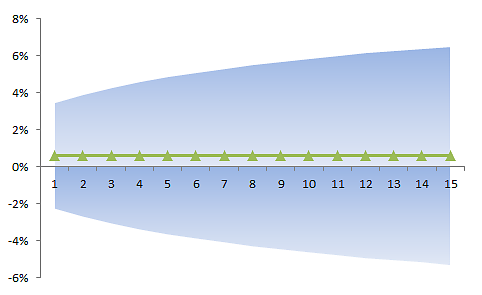
Plot for Forecast values and their confidence interval
In the plot, we have the mean forecast (line), and the 95% confidence interval represented by the shaded area.
-
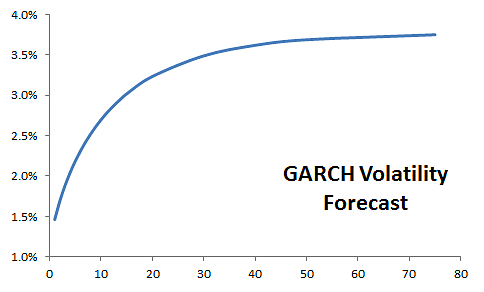
GARCH(1,1) Local olatility forecast for S&P 500 log monthly returns
In this plot, we show the local volatility (aka forecast standard error) over the forecast horizon. Note that volatility revert to…
-
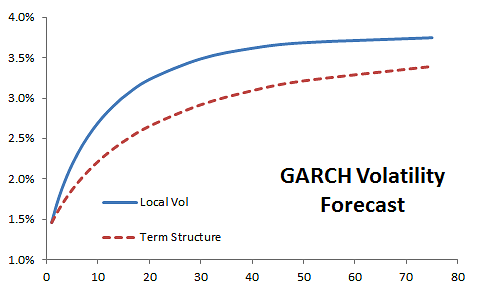
Plot for Local and term structure volatility forecast using GARCH model
In this plot, the local (aka forecast error) and term structure volatility forecast are plotted together. Note that both curve con…