msft-prices-q1-q3-band.png
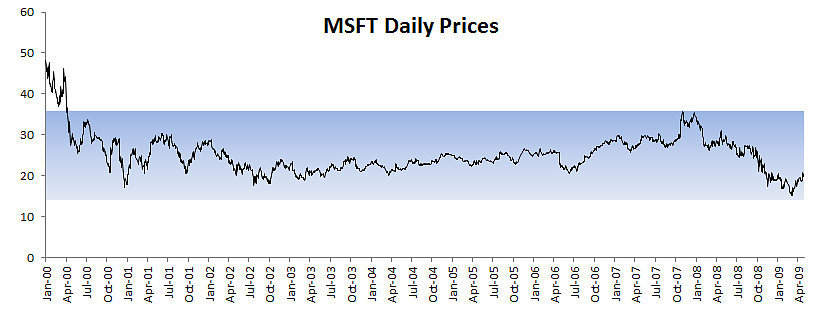
Microsoft stock price plot with a shaded band represent values between 1st quartile (Q1) and third quartile (Q3)
Microsoft stock price plot with a shaded band represent values between 1st quartile (Q1) and third quartile (Q3)