EN
-
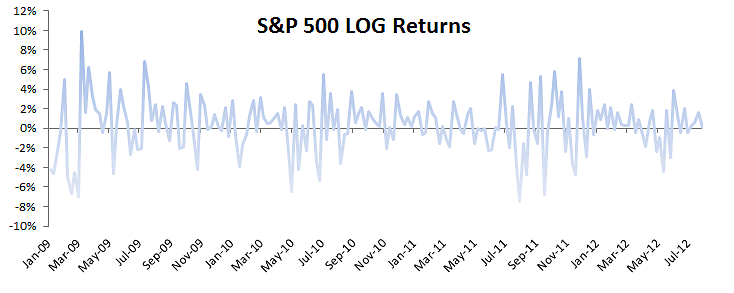
Plot for S&P 500 monthly log returns
A plot for the S&P 500 ETF log monthly returns between Jan 2009 and July 2012
-
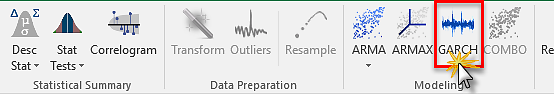
Selecting GARCH Wizard in NumXL Tab
Locate the GARCH icon in NumXL Toolbar (aka Tab), and click it to invoke the ARCH/GARCH Wizard.
-
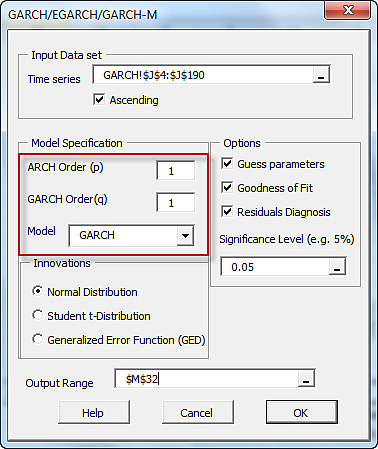
NumXL ARCH/GARCH Wizard
In the NumXL GARCH model wizard, enter the orders of the ARCH and the GARCH components. Leave Model selection to as GARCH
-
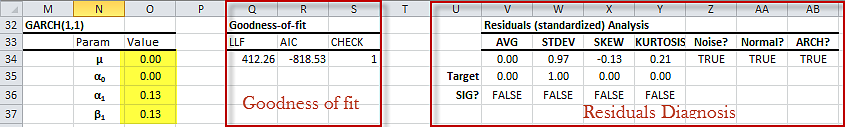
GARCH(1,1) Model table
The GARCH(1,1) model output table generated by NumXL GARCH wizard for the S&P 500 ETF log monthly returns time series.
-
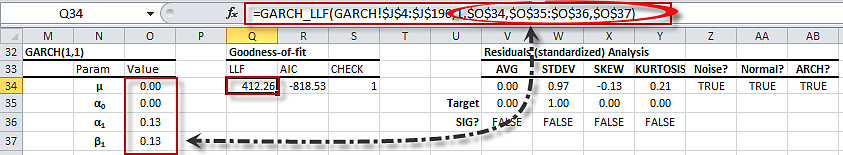
Generated formulas in the GARCH(1,1) model table
The generated GARCH(1,1) model table is dynamic; note that cells are populated with formulas the references model's parameters cel…
-
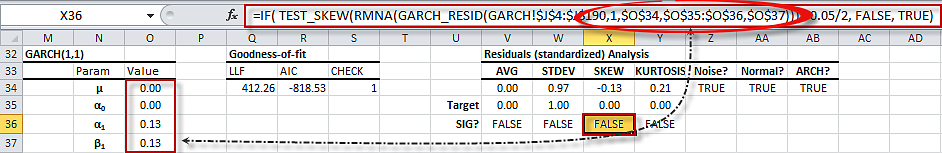
Generated Formulas in the Residual Diagnosis section of GARCH model table.
The Residuals diagnosis section of GARCH(1,1) model table is dynamic; note the generated formula references the input cells range…